Taking CO2 out of the air – a practice known as carbon dioxide removal (CDR) – is increasingly recognised as a crucial part of achieving climate goals, alongside rapidly reducing emissions.
Yet, some basic questions remain unanswered: How much is already happening around the world? How fast is it growing? Are we on track to deliver what may be needed?
In a new report, released today, we endeavour to answer these questions and help make information on CDR more accessible.
For the first time, we are able to estimate the total amount of CDR currently being deployed around the world and compare it to what is in modelled pathways that meet the Paris climate goals.
We find a gap between how much CDR countries are planning in the coming decades and what is required to limit warming to 1.5C or 2C above pre-industrial levels. But alongside this “gap”, we also find rapid growth in innovation, academic research and public attention on CDR.
Below, we explain – via seven charts – what light the report sheds on the current state of CDR:
1. Virtually all CDR happening now comes from managed forests
CDR, sometimes also referred to as “negative emissions”, refers to a number of different activities by which CO2 is captured from the air and stored durably on land, in the ocean, in geological formations or in products.
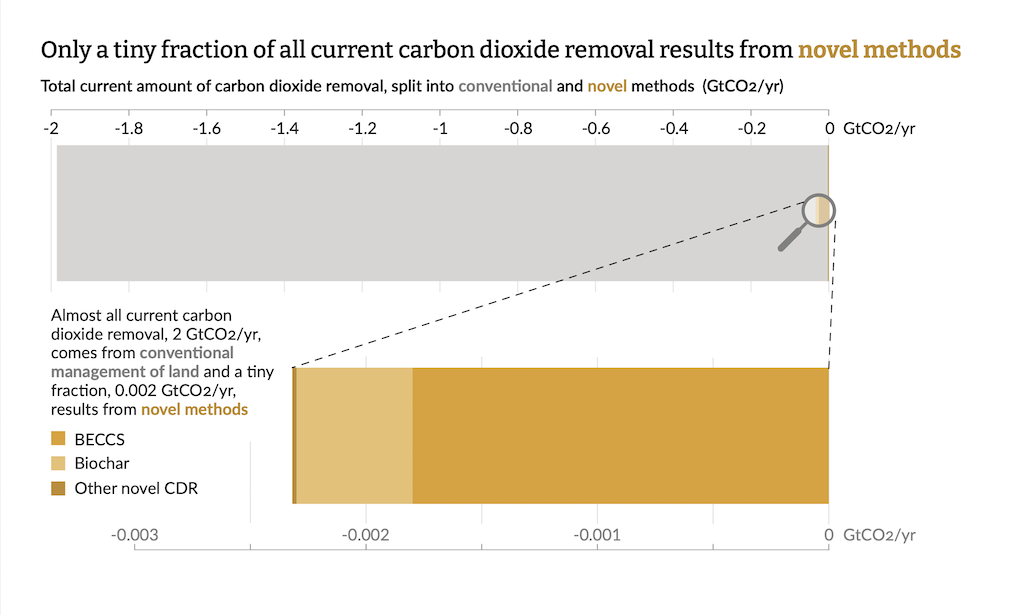
We estimate that the amount of CDR currently happening around the world is approximately 2bn tonnes of CO2 (GtCO2) per year. This is small relative to current CO2 emissions of 36.6GtCO2 per year from fossil fuels and cement, but perhaps larger than many might expect.
The vast majority of current CDR (99.9%) comes from what we, in this report, term “conventional CDR on land”. This includes the creation of new forests, restoration of previously deforested areas, increases in soil carbon and use of durable wood products, such as panels and sawnwood used in construction.
Only a small amount of current CDR, an additional 0.0023GtCO2 per year, comes from “novel” CDR methods. These include bioenergy with carbon capture and storage (BECCS), biochar, direct air carbon capture and storage (DACCS), enhanced rock weathering and coastal wetland (sometimes called “blue carbon”) management.
While novel CDR projects often get the news coverage, they collectively account for just 0.1% of all current CDR deployment.
In general, conventional CDR methods on land are already practised at scale. Done well, they can provide additional benefits, notably to biodiversity. But they are limited by available land, and the carbon removed by trees and soils is prone to reversal from disturbances and from climate change itself.
Novel CDR methods are generally at earlier stages of development. There is less certainty about their costs, benefits and hazards but they may potentially be able to offer more durable carbon storage than trees and soils.
2. All pathways that meet global climate goals involve additional CDR
In its most recent assessment, the Intergovernmental Panel on Climate Change (IPCC) included 541 pathways that limit global temperature rise to 1.5C or 2C. While the IPCC provided numbers for the amount of novel CDR in these pathways, it did not disentangle emissions and removals from activities on land, due to data limitations at the time.
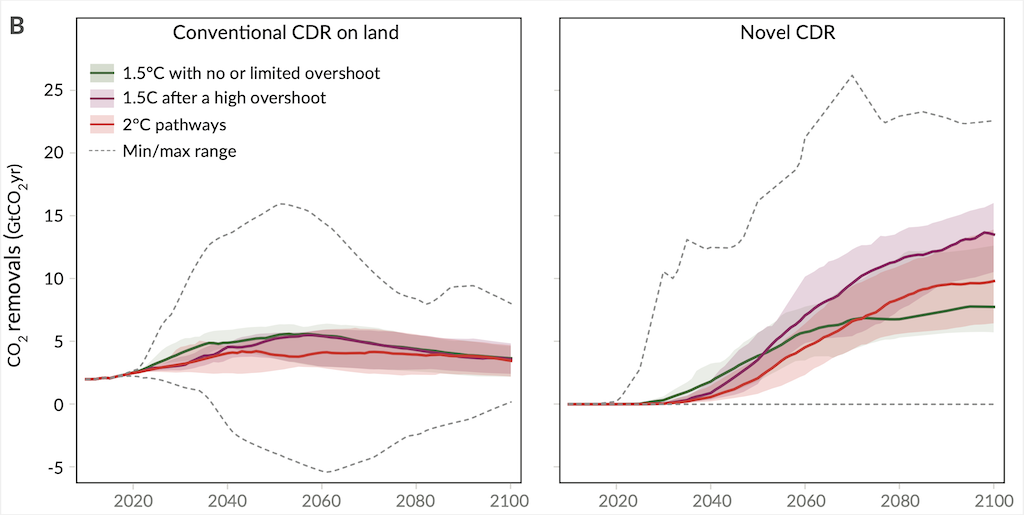
For the first time in this report, we provide a calculation of total CDR in pathways that limit temperature rise to 1.5C and 2C, including all methods. All pathways that limit warming to 1.5C or 2C involve substantial levels of CDR between 2020 and 2100, ranging from 450 to 1,100 GtCO2.
This is, of course, in addition to immediate and deep reductions in emissions. The greatest contribution between 2020 and 2030 in these pathways comes from reducing emissions (by 14-27GtCO2 per year for the 5th-95th percentile range, compared to 0.8-5.4GtCO2 per year coming from removals).
Nevertheless, CDR becomes increasingly important in the longer term. By 2050, the amount of CDR in pathways that limit warming to 1.5C or 2C grows to 4.8GtCO2 (0.58 to 13) per year above 2020 levels. Conventional CDR peaks around 2050 while novel CDR methods typically increase throughout the century.
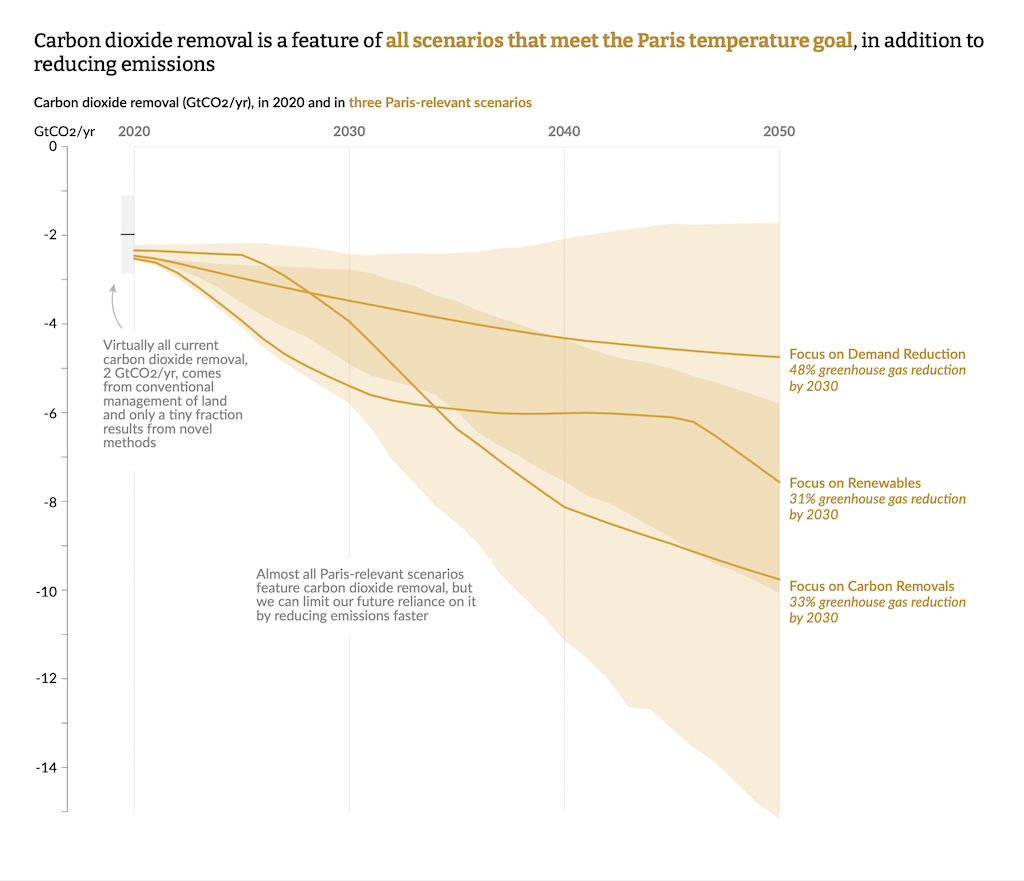
Importantly, we can limit our dependence on CDR. A few pathways limit warming to 1.5C or 2C with relatively modest increases in conventional CDR on land and no novel CDR at all. These require even more aggressive emissions reductions (around 50% of total greenhouse gases by 2030) by increasing renewable energy, reducing energy demand and limiting unabated fossil fuel processes.
If we remain off-track to achieve these emissions cuts, either the CDR requirement increases or the Paris temperature goal moves further out of reach.
3. There is a gap between how much CDR countries are planning and what is needed to meet the Paris temperature goal
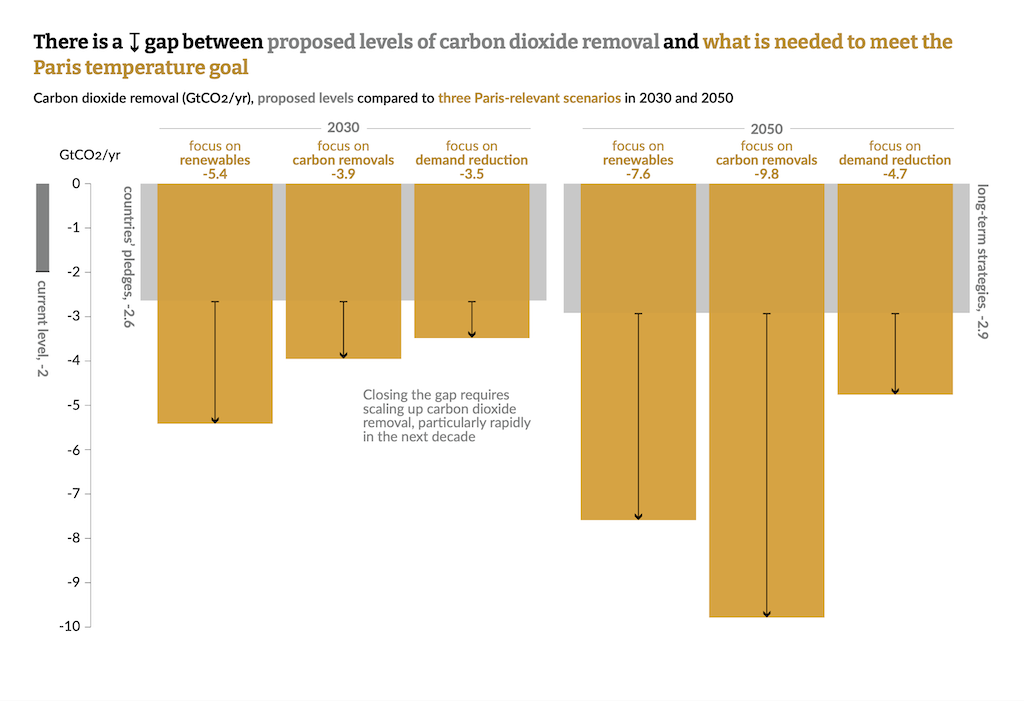
Countries have set out pledges for actions they intend to take by 2030 to mitigate climate change through their nationally determined contributions (NDCs). Together, these pledges include an additional 0.1 to 0.65GtCO2 per year of CDR by 2030. Several countries plan to maintain or slightly increase conventional CDR on land by 2030 but none of the NDCs contain pledges to scale novel CDR. The shortfall relative to pathways that limit warming to 1.5C or 2C reveals a gap already emerges by 2030.
Only a few countries have also set out long-term mitigation strategies, which indicate what they may do to tackle climate change by 2050. Of these, even fewer contain enough detail to estimate the amount of CDR being considered. In those that do, the CDR by 2050 amounts to 1.5 to 2.3GtCO2 per year.
This exposes a significant gap relative to the average amount of CDR required in pathways that limit warming to 1.5C or 2C of 4.8GtCO2 per year by 2050. Unlike the NDCs, however, some long-term strategies do include novel CDR methods.
Governments have a role not only in making pledges and strategies, but also in developing the policies that catalyse and regulate CDR. The focus to date has been on conventional CDR on land, through forestry and agriculture. In the report, we discuss how attention on BECCS, DACCS and other novel CDR methods is rising, for example, in Brazil, the European Union, the UK and US.
4. CDR research is concentrated on particular methods and regions
While currently accounting for only 4% of the English-language scientific literature on climate change, the number of publications on CDR is growing fast, doubling every three to four years. Studies analysing biochar, soil carbon sequestration and afforestation/reforestation account for about 80% of the CDR literature, with BECCS and DACCS receiving comparatively little attention.
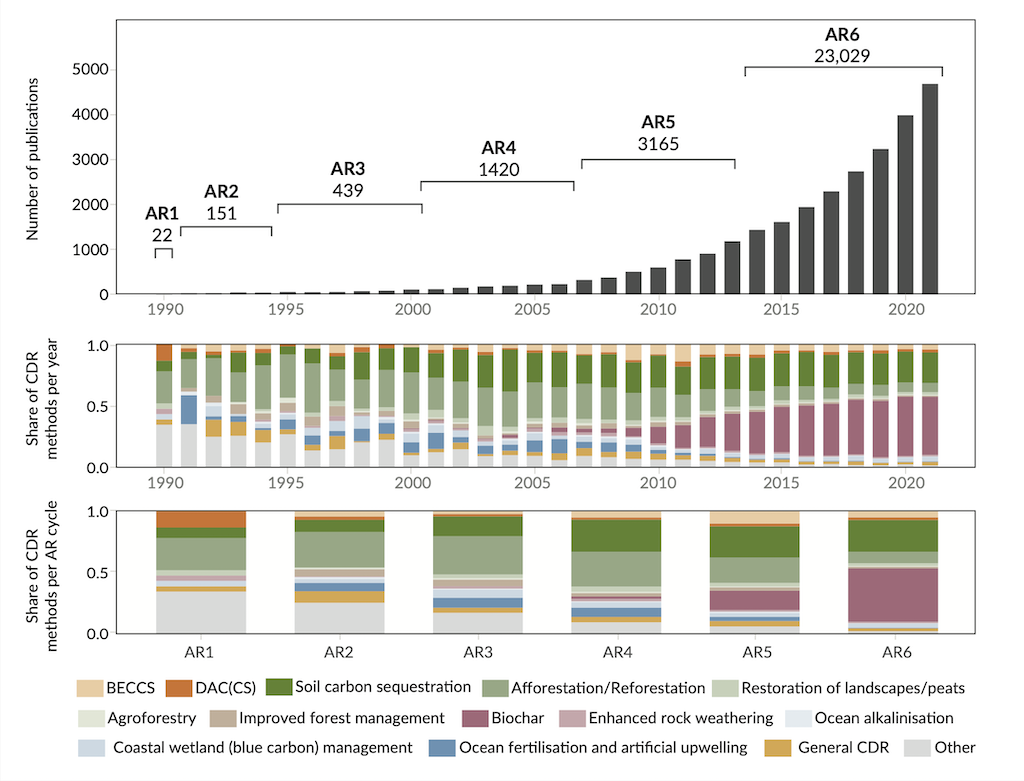
Only a third of scientific studies on CDR have a geographical focus, highlighting a potential lack of information tailored to local contexts. This is particularly acute for Africa and South America. Also striking is the preponderance of studies in natural and physical sciences – only 3% are published in social science journals, despite the importance of social practices and public perceptions in determining the course of action.
5. Innovation in CDR is active and growing
Governments are investing in public Research and Development (R&D). Direct funding for CDR totalled around $4.1bn between 2010 and 2022, concentrated in a few regions. Proposed direct air capture (DAC) demonstration hubs in the US account for the vast majority of traceable public funding ($3.5bn).
Innovation in CDR is also being turned into intellectual property and new businesses. Global CDR patents have increased in number and diversified in terms of technological focus over the last 15 years, with a large and growing share occurring in China. In 2018 – the last year of complete application data – China accounted for over a third of all CDR patents.
Purchases of removed CO2 totalled approximately $200m between 2020 and 2022. The vast majority of announced purchases focus on DACCS, with biochar the next most prominent method.
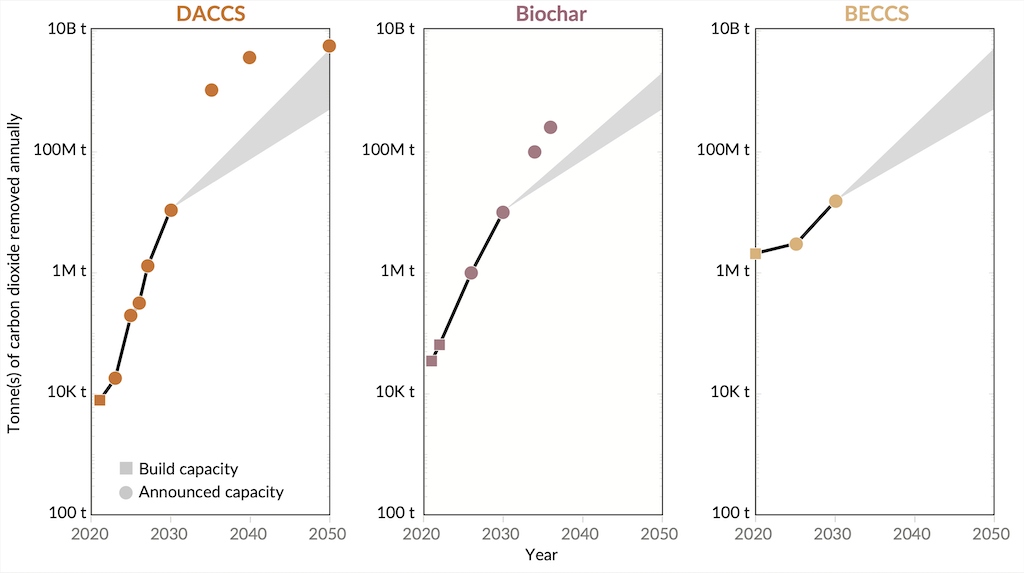
Meanwhile, various companies and industry groups have made ambitious announcements about further scaling CDR. For DACCS, biochar and BECCS, in particular, these announcements currently align broadly to a path meeting mid-century potentials, as estimated in the literature. But the industry is currently five orders of magnitude smaller than those potentials, and it remains to be seen if it can deliver on these announcements.
6. Public awareness is low, but CDR is becoming more of a talking point
The role of CDR is not without controversy – and how people perceive CDR will be a crucial influence over which, where and how CDR methods are allowed to develop. Our analysis found 39 studies specifically on public perceptions of CDR, of which only 10 are from outside Western Europe and North America.
Among the general public in the countries studied, awareness of CDR (as a general topic and regarding specific CDR methods) is low and perceptions of this nascent field are still forming. Studies indicate reasonable public support for research into CDR, but less for deployment at scale, driven by concerns including potential adverse side effects and tampering with nature.
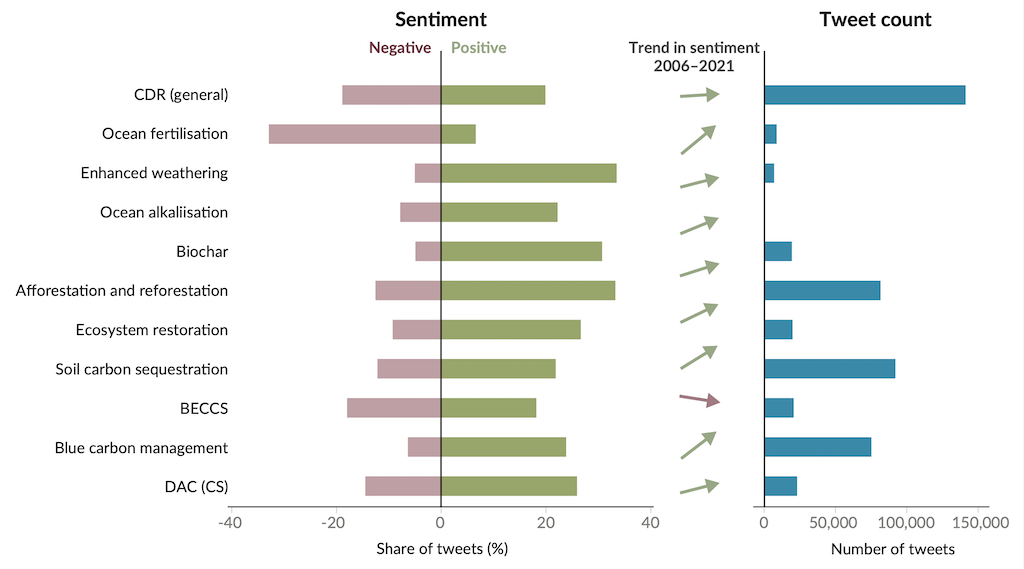
Social media provides a larger, but less representative environment for studying perceptions. The number of tweets on CDR has grown from about 15 per day in 2010 to 350 per day in 2021. The content of these tweets suggests that familiar CDR methods (particularly afforestation/reforestation) are generally referred to more favourably than others. Sentiment towards all CDR methods have become more positive over time, with the single exception of BECCS.
7. The coming decade is crucial for future CDR
Our assessment of current CDR and the amount required in pathways that limit warming to 1.5C or 2C suggests that meeting the goals of the Paris Agreement requires us to accelerate emission reductions, increase conventional CDR and rapidly scale up novel CDR.
Compared to 2020, pathways that limit warming to 1.5C or 2C see conventional CDR on land scale up by a factor of 1.3 (0.95 to 2.2) by 2030 and a factor of 2 (0.19 to 3.5) by 2050. For novel CDR these scale-up factors are much higher: 30 (0 to 540) by 2030 and 1,300 (260 to 4,900) by 2050.
The next decade is crucial for novel CDR, in particular, since the amount of CDR deployment required in the second half of the century will only be feasible if we see substantial new deployment in the next ten years – novel CDR’s formative phase.
Good, accessible information will be needed if CDR is to play a constructive role in halting climate change, alongside reducing emissions. Currently, information is widely dispersed and of varying quality.
Our initial assessment of the state of CDR is made possible through the efforts of over 20 researchers. Over time, there is much scope to improve the data and expand the community of contributors.
We intend for this report to be the first in a series: continuing to track the CDR gap and providing a clear, authoritative and up-to-date snapshot, serving as an information resource for those who are making decisions about CDR and its role in meeting climate goals.
First published on 19 January 2023 in Carbon Brief

